
Silver’s Third Act: Is This Bull Market Only Halfway Up the Mountain?
Silver is in the middle of its “third act” bull market, echoing the explosive runs of the 1970s and 2000s but with a new twist: structural supply deficits and soaring industrial demand from solar, EVs and the digital power grid. Combined with record sovereign debt, negative real yields, and growing distrust in fiat, the current silver bull market may be far from finished, even if volatility remains brutal.
Silver is on fire. Breaking out above $60 per ounce it is now outperforming gold and the miners as it rips higher. But, the last few great silver bull market looks the same, until the very end.
In the 1970s, silver climbed from pocket change to nearly $50 an ounce as inflation raged, trust in government evaporated, and a couple of Texas billionaires (the Hunt Brothers) tried to corner the market. In the 2000s, it did it again, running from about $4 to almost $50 as China industrialized, central banks turned on the QE firehose, and investors fled the wreckage of the global financial crisis.
Now, silver is back in the spotlight. After about 15 years of consolidation, prices have broken out of a decade-long range and pushed into fresh nominal highs, while the gold–silver ratio has begun to fall, signaling that silver is finally outpacing its “big brother” again. To anyone who has studied the metal’s history, the pattern feels familiar.
The question hanging over today’s market isn’t whether silver is in a bull run, that part is obvious. The real question is where on the mountain are we? Halfway up? Near the summit? Or just leaving base camp?
Base Camp: The Historical Template for Silver Mania
Before you can judge this bull, you have to understand what real silver manias look like.
In the 1970s, silver’s move wasn’t just big, it was insane. The metal went from roughly $1.50 to almost $50 over the decade, a ~30× increase, with the final years delivering a parabolic blow-off. In January 1980, the gold–silver ratio briefly collapsed toward 15:1 as silver became wildly expensive relative to gold. Adjusted for inflation, that 1980 spike is roughly equivalent to well over $150 per ounce today. Check out historical silver prices and the inflation-adjusted 1980 peak.
The 2001–2011 bull run was less dramatic but still spectacular. Silver climbed from a little over $4 to almost $50, about a 12× move, before the rally ended in 2011. The trigger then was different: China’s commodity supercycle, the aftermath of the dot-com bust and housing crash, and the debut of silver ETFs that opened the market to a new wave of investors. At the peak, the gold–silver ratio compressed into the low 30s.
Both episodes share a few common traits:
- A macro regime shift (inflation, monetary experimentation, loss of faith in fiat)
- A period of underinvestment and tight supply
- An eventual FOMO blow-off, when everyone suddenly “discovers” silver at the same time
That’s the template. The current bull is already following parts of it, but with a twist.
The Climb: Fundamentals Driving Today’s Silver Bull
The biggest difference in this cycle is that silver is no longer just “poor man’s gold.” It’s become deeply embedded in the plumbing of the modern economy, especially the green and digital transitions governments keep promising voters.
1. Structural Deficits: Demand Exceeds Supply
For several years now, the silver market has been running structural deficits, annual shortfalls where total demand outstrips mine supply and recycling. The Silver Institute has documented consecutive global deficits driven by surging industrial demand and flat-to-modest mine growth. Cumulatively, those deficits add up to hundreds of millions of ounces.
Deficits in any commodity don’t matter… until they suddenly do. You can paper over shortfalls by drawing down above-ground stocks, leasing metal, or deferring some industrial demand. But eventually the market notices that the tank is being drained faster than it’s being filled.
Today’s silver bull is, at its core, the market waking up to that math.
2. Silver’s New Job: Powering the Energy Transition
Silver is now critical to several “must-happen” policy goals:
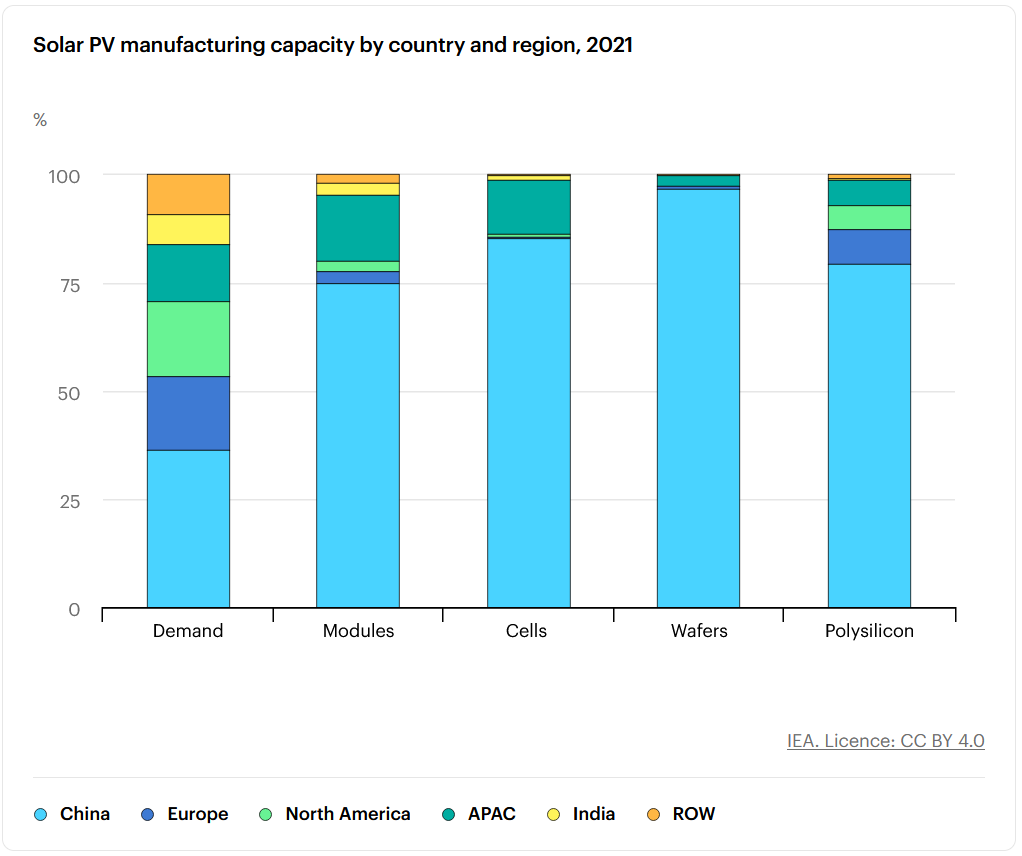
- Solar power: Silver paste is a key component in photovoltaic (PV) cells. Even with ongoing thrifting, total silver use in solar has hit record highs as global panel installations surge.
- EVs and electronics: Every electric vehicle and virtually every advanced electronic device carries silver in its wiring, connectors, and sensors.
- Grid and data infrastructure: As power grids and data centers expand to handle AI, electrification, and higher baseload demand, silver’s role in high-reliability connections grows with them.
Estimates vary, but a significant and rising share of annual silver demand now comes from these industrial and “green” uses, many of which are price-inelastic. Governments may dither on budgets, but once you’ve committed to a grid or solar build-out, a higher silver price is a rounding error in the total project cost. The West is behind and will have to shore up its own supply chains if it wants to compete with China as can be seen here.
That’s a very different story from 1980, when speculative hoarding and financial panic did most of the heavy lifting.
3. The Monetary Backdrop: Debt, Deficits, and Negative Real Yields
Overlay those industrial fundamentals with today’s monetary backdrop, and the climb starts to look steeper:
- Government debt and deficits are at or near wartime levels in many developed countries.
- Central banks are torn between fighting inflation and keeping debt service costs manageable.
- Even when nominal yields rise, real yields (after inflation and taxes) look far less compelling.
In such an environment, it doesn’t take much for investors, especially the macro-focused, risk-tolerant crowd, to start allocating to scarce, hard assets. Gold tends to move first. Silver historically follows, but faster and further once the move is underway. We've seen gold move in the past few years, now silver is outpacing it.
You can argue that today’s silver bull is where gold was a couple of years ago: a market that has already re-rated once, but hasn’t yet experienced genuine retail or institutional mania.
The Ridge Line: How High Could Silver Go?
No one can say with certainty how high silver will go in this cycle. But history gives us useful signposts, not as predictions, but as scenarios.
Think in terms of three lenses: inflation adjustment, relative value to gold, and historical multiples.
Scenario 1: Simply Matching the 2011 Peak (Real Terms)
On an inflation-adjusted basis, the 2011 high near $50 equates to roughly the high-$50s to low-$60s in today’s dollars, depending on which inflation series you use. In other words, just regaining the 2011 real peak isn’t particularly heroic.
If this bull market merely matches that achievement in real terms, then we’re probably not far from that zone already, or may have just entered it, depending on your price snapshot and CPI assumptions. That would fit a narrative of “late-cycle, but not yet extreme.”
Scenario 2: Revisiting the Spirit of 1980
The 1980 spike is another story. Adjusted for inflation, that mania peak is somewhere north of $150 an ounce in today’s money.
Is that realistic? You could argue that the 1980 episode was uniquely distorted by the Hunt brothers, leverage, and sudden regulatory changes. On the other hand, today’s global financial system is vastly larger, debt loads are far heavier, and silver is more deeply integrated into critical infrastructure than it was back then. If even a small fraction of global capital decided it needed silver exposure at the same time, price could overshoot fundamentals in a blink.
A repeat of that kind of real-term peak would imply a 3×–4× move from recent breakout levels, not the 30× explosion of the 1970s, but from a far higher starting point.
Scenario 3: The Gold–Silver Ratio Compresses
Another way to frame silver’s upside is via the gold–silver ratio (GSR), how many ounces of silver it takes to buy an ounce of gold.
Historically:
At “calmer” times, the ratio has hovered anywhere between 50:1 and 80:1. At silver bull market peaks, it has often compressed toward 30:1 (2011) or even the mid-teens (1980).
Imagine a simple thought experiment:
Suppose gold consolidates or trends higher in a long, grinding bull.
If the GSR compresses from a high starting point (say, 80:1) down to 40:1 or 30:1, silver’s price must rise much faster than gold’s to make the math balance.
You don’t need aggressive assumptions on gold to get interesting numbers for silver under those ratio scenarios. That’s why silver is often called “gold with a turbocharger.” When the ratio moves in its favor, modest changes in gold can translate into outsized gains in silver.
Again, none of these are forecasts, they’re frames. But they show that, relative to history, the current bull market is powerful, yet far from the most extreme silver has ever been.
The Descent: Risks, Volatility, and Why Silver Punishes Complacency
For all its upside potential, silver has a brutal way of reminding investors that mountains go down as well as up.
Three recurring risks stand out:
Volatility cuts both ways. Silver is notorious for 20–30% corrections in the middle of a bull run. These can come out of nowhere: a policy surprise, a temporary easing of energy prices, or simply profit-taking after a strong move.
Leverage and paper games. Futures and derivatives can amplify both rallies and crashes. When too much speculative leverage piles into the same trade, small shifts in narrative can trigger outsized moves in price.
Policy shifts and substitutions. Technology can thrift silver content in some applications, and governments can change subsidy structures or industrial policies that indirectly support demand. A long-term structural bull doesn’t mean a straight line.
History’s reminder is simple: the same qualities that make silver exciting, its dual role as money and metal, its sensitivity to macro stress, its relatively small market size—also make it ruthless for latecomers who mistake momentum for guarantee.
Where Might We Be on the Mountain?
Putting it all together, here’s a reasonable way to think about the current silver bull:
In terms of time and multiples, we’re somewhere in the middle of the historical range as it relates to bull markets in silver: silver is running and up over 100% this year, but still shy of the decade-long, 10–30× secular moves that defined the 1970s and 2000s.
In real, inflation-adjusted price, we’re probing the territory of the 2011 peak, but still far below the 1980 blow-off.
In relative terms, the gold–silver ratio has started to move in silver’s favor, but not yet to the extreme levels that have historically marked final, manic tops.
Fundamentally, the industrial and green-energy story is stronger than in past cycles, and the monetary backdrop (debt, deficits, policy constraints) is at least as supportive.
That combination suggests a market that is well into a structural bull, but not clearly at its endgame, yet. If history rhymes, the most violent price action often occurs late in the cycle, when fundamentals, narratives, and investor psychology all reach a tipping point at once. We're not there yet, but it could be beginning in 2026 or 2027.
Final Word: Not a Forecast, Not Advice
Nothing in this article is a prediction, and it certainly isn’t financial advice. Silver is volatile, cyclical, and unforgiving; it can fall as far and as fast as it rises. Any investor considering exposure should do their own due diligence, understand their risk tolerance, and consult a licensed financial professional.
But history is clear on one thing: when silver decides to move, it rarely does so quietly or politely. Whether we are halfway up the mountain or closer to the summit, this bull market is being driven by forces, monetary and industrial, that won’t vanish overnight.
For macro-focused, high-risk investors, the real story isn’t just where silver is today. It’s the growing recognition that in a world of mounting promises and shrinking trust, a small, stubborn metal is once again being asked to do a very big job.

Latest Insights
Recent Highlights from Our YouTube Channel
Comprehensive reviews of current market dynamics and the latest trends influencing the future of investments.